
Why optimise website speed: the business case in 2026
June 7, 2026
What is inbound marketing? A practical guide for SMBs
June 9, 2026
TL;DR:
- Measuring website performance is essential for SMBs to enhance search rankings, conversions, and brand trust. Core Web Vitals—LCP, INP, and CLS—are key metrics that influence both SEO and user experience, with field data reflecting real user conditions. Continuous monitoring and prioritizing fixes based on business impact ensure lasting improvements and protect revenue over time.
Measuring website performance is the practice of quantifying how effectively your website delivers a fast, responsive, and stable experience to real users. For SMB owners and marketing professionals, this discipline sits at the intersection of technical health and commercial results. Core Web Vitals, Google’s standardised set of user experience signals, directly influence your search rankings and how visitors perceive your brand. Tools like Google PageSpeed Insights and DebugBear make this measurement accessible without a dedicated engineering team. Understanding why measure website performance matters is the first step toward turning your website from a digital brochure into a revenue-generating asset.
Why measure website performance: the business case
Website performance measurement is not a technical exercise reserved for developers. It is a business intelligence practice that tells you whether your site is winning or losing customers before they ever speak to you.

The commercial stakes are concrete. Every 100ms delay reduces conversions by approximately 1%, and Amazon’s own analysis shows a one-second delay cuts sales by 1%. For a Luxembourg SME generating €500,000 in annual online revenue, a two-second performance regression is not an abstract metric. It is a measurable revenue leak.
Beyond direct sales, performance shapes trust. Slow sites reduce mid-funnel engagement including form submissions, demo requests, and document downloads. A visitor who waits too long does not complain. They simply leave, and they rarely return. This means performance is a brand problem as much as a technical one.
Google reinforced this commercial link in 2021 by incorporating Core Web Vitals into its ranking algorithm. A site that passes Core Web Vitals thresholds gains a ranking signal advantage over slower competitors in the same niche. For SMBs competing in Luxembourg’s relatively concentrated market, that margin matters.
What are the key metrics used to measure website performance?
Performance measurement relies on a defined set of metrics, each capturing a different dimension of the user experience. Understanding what each metric measures helps you prioritise fixes that actually move the needle.
Core Web Vitals: the three metrics Google uses for rankings
Google’s Core Web Vitals consist of three signals with specific pass thresholds:
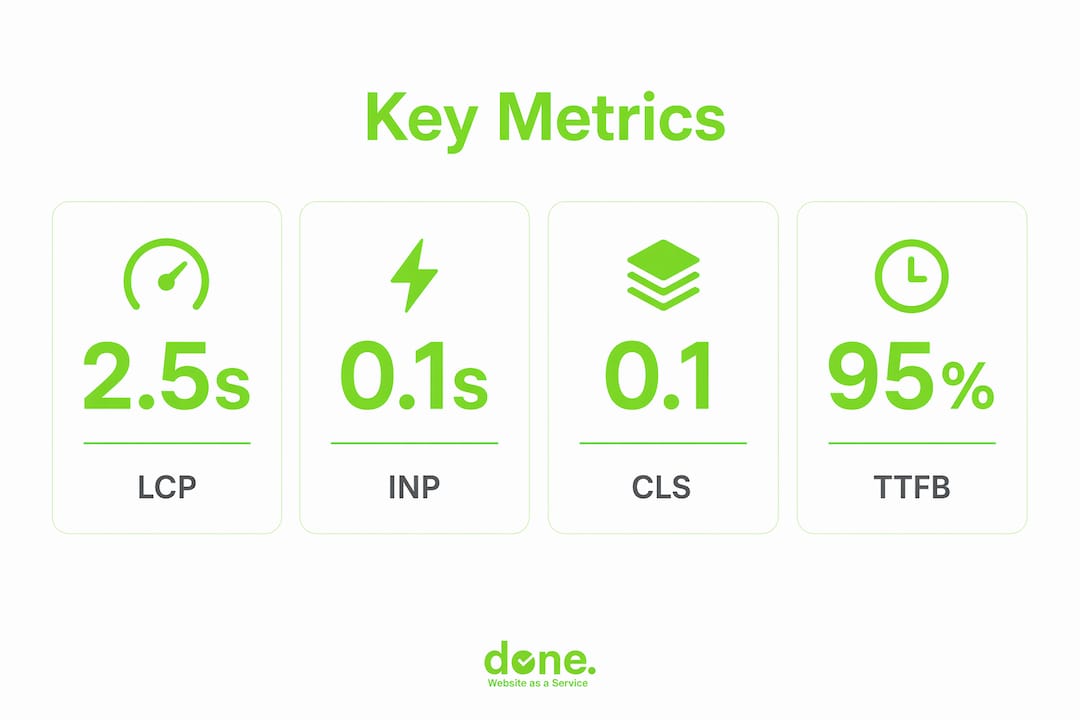
- Largest Contentful Paint (LCP): measures how long it takes for the largest visible element on the page to load. The “good” threshold is 2.5 seconds or less. LCP is typically your hero image, a large heading, or a video thumbnail.
- Interaction to Next Paint (INP): measures the latency of every user interaction, from clicks to keystrokes. INP replaced FID in 2024 as the primary interactivity metric because it captures the worst-case interaction across a full session, not just the first one. The good threshold is 200 milliseconds or less.
- Cumulative Layout Shift (CLS): measures visual stability. A score below 0.1 means your page elements are not jumping around as the page loads, which frustrates users and causes mis-clicks.
Additional metrics worth tracking
Beyond Core Web Vitals, several supporting metrics help diagnose root causes:
- Time to First Byte (TTFB): how quickly your server responds. A slow TTFB often points to hosting quality or server-side processing issues.
- First Contentful Paint (FCP): when the first piece of content appears on screen. This shapes the user’s initial perception of speed.
- Time to Interactive (TTI): when the page becomes fully usable. A page can look loaded but remain unresponsive if JavaScript is still executing.
Pro Tip: Do not treat these metrics in isolation. A good LCP score paired with a poor INP score means your page loads visually but feels broken to interact with. Both matter for user experience and rankings.
Lab data vs field data: knowing the difference
Performance data comes from two fundamentally different sources, and confusing them leads to wrong priorities.
Lab data, generated by tools like Google Lighthouse and WebPageTest, runs your site under controlled conditions. It is excellent for diagnosing specific issues and testing fixes before deployment. Field data, collected through Chrome User Experience Report (CrUX) and Real User Monitoring (RUM) tools, reflects actual user experiences across real devices, networks, and geographies. Google uses field data, not lab data, for ranking decisions. This distinction is critical for any SMB trying to understand why their PageSpeed score looks fine but their rankings are not improving.
How does website performance affect SEO and revenue?
The relationship between performance metrics and business outcomes is direct and quantifiable. Here are the four most significant commercial impacts:
-
Search visibility. Google evaluates Core Web Vitals at the 75th percentile of page visits, meaning your score is set by your slowest 25% of users. If your site loads quickly for most visitors but slowly for users on mobile networks or older devices, Google still classifies it as slow. Passing all three Core Web Vitals thresholds earns a ranking signal that competitors who fail them do not receive.
-
Conversion rates. The Akamai research cited alongside Amazon’s data identifies peak conversions at a 3.3-second load time. Beyond that point, every additional second of delay compounds the drop-off. For e-commerce or lead generation pages, this is the most direct line between a technical metric and revenue.
-
Bounce rate and session depth. Slow pages increase bounce rates, which reduces the number of pages a visitor views and the time they spend on your site. Both signals feed into Google’s understanding of content quality, creating a compounding SEO disadvantage.
-
Brand perception and trust. Performance affects perception of quality. A slow website signals to a potential client that your business does not invest in its digital presence. In professional services sectors common in Luxembourg, such as legal, finance, and consulting, that perception can be decisive.
“Treating page speed as part of the brand promise changes how teams prioritise performance work. It stops being a developer task and becomes a business priority.”
Combining performance data with business analytics, including conversion rates, device types, and traffic sources, reveals which specific issues are costing you revenue and which fixes will deliver the highest return. This is how performance measurement becomes a genuine business intelligence tool rather than a technical report.
How to interpret performance data without being misled
Performance data is only useful if you read it correctly. Several common misinterpretations cause SMBs to invest time and budget in the wrong places.
The aggregate score problem
Google PageSpeed Insights produces a single score between 0 and 100. That number is a composite, and it is less useful than examining the individual Core Web Vitals it is built from. Aggregated scores are less actionable than analysing each metric driver separately and setting performance budgets aligned to specific business goals. A site scoring 72 overall could have a perfect CLS and a failing LCP. Fixing the LCP will improve rankings. Chasing the aggregate score might lead you to optimise the wrong things.
Origin-level vs URL-level data
CrUX data is available at two levels: origin (your entire domain) and individual URL. Low-traffic pages often lack enough real user data to generate URL-level scores, so Google falls back to origin-level data. URL-level and origin-level data serve different purposes. Origin data gives you a broad picture of your site’s health. URL data tells you whether a specific page, such as your pricing page or contact form, is passing or failing for real users. For SMBs with limited traffic, synthetic monitoring tools like DebugBear or WebPageTest fill the gap by simulating user visits to specific pages.
The 75th percentile rule
Google does not measure your best-case performance. It measures the experience of your slowest 25% of users. This means a site that loads in 1.5 seconds for most visitors but takes 4 seconds for users on a 4G mobile connection in rural Luxembourg will fail LCP. Optimising for the median user is not enough. You need to understand the full distribution of your user experiences, which requires field data or RUM tools.
Pro Tip: Use Google Search Console’s Core Web Vitals report as your starting point. It shows you which URLs are failing and whether the issue is desktop or mobile. Then use a lab tool like Lighthouse to diagnose the specific cause.
Avoiding the homepage-only trap
Many SMBs measure only their homepage. Homepage speed does not predict conversion page performance. Your contact page, product detail page, or service enquiry form may be significantly slower and far more commercially important. Measure the pages where users make decisions, not just the page where they arrive.
What are the best practices for ongoing performance monitoring?
Measuring website performance once is useful. Measuring it continuously is what protects your rankings and revenue over time.
Set up continuous monitoring, not quarterly audits
Synthetic monitoring at 1 to 5 minute intervals identifies performance regressions within minutes of a deployment or server issue. Quarterly audits detect the same problems weeks after they have already damaged your rankings and user experience. For SMBs without a dedicated development team, a lightweight monitoring tool running automated checks is far more effective than periodic manual reviews.
Map metrics to your customer journey
The most effective approach to performance measurement is to align your monitoring with the pages that matter most to your business:
- Awareness pages: blog posts, landing pages, and service overviews. These need fast LCP to retain organic traffic.
- Consideration pages: case studies, pricing pages, and comparison content. Poor INP here means users cannot interact smoothly with your content.
- Conversion pages: contact forms, checkout flows, and booking pages. Every millisecond of delay on these pages has a direct revenue cost.
Tracking performance at this level of granularity, rather than monitoring a single homepage score, gives you data that connects directly to your digital marketing strategy and commercial objectives.
Set performance budgets
A performance budget is a defined threshold for each metric on each key page. For example: LCP must stay below 2.5 seconds on the checkout page; CLS must stay below 0.05 on all landing pages. When a deployment or third-party script pushes a metric over budget, your monitoring tool alerts you immediately. This turns performance from a reactive concern into a proactive standard. Done has used this approach with clients to prevent performance regressions after CMS updates, plugin additions, and marketing tag deployments.
Combine performance data with marketing analytics
Analysing performance alongside conversion rates, customer segments, and traffic sources reveals patterns that neither dataset shows alone. A page with good Core Web Vitals but a high bounce rate may have a content or relevance problem. A page with poor INP and low conversion may be losing users to interaction frustration. Google Search Console, Google Analytics 4, and a RUM tool used together give you this combined view. Understanding how UX and SEO interact is the foundation for making performance data genuinely useful to your marketing team.
Prioritise fixes by impact, not complexity
Not every performance issue deserves equal attention. A failing LCP on your most-visited service page outweighs a minor CLS issue on a rarely-visited blog post. Prioritise fixes based on the commercial importance of the page and the severity of the metric failure. Avoid over-optimising pages that already pass all Core Web Vitals thresholds. Improving beyond the “good” threshold offers minimal additional SEO benefit. Direct that effort toward pages that are still failing.
Key takeaways
Measuring website performance is the single most direct way to connect your technical website decisions to real business outcomes, including search rankings, conversion rates, and brand trust.
| Point | Details |
|---|---|
| Core Web Vitals drive rankings | LCP, INP, and CLS are evaluated at the 75th percentile; failing any one metric costs you a ranking signal. |
| Field data is what Google uses | CrUX and RUM tools reflect real user experiences; lab tools like Lighthouse are for diagnosis only. |
| Measure revenue-critical pages | Homepage scores do not predict checkout or contact page performance; monitor where decisions are made. |
| Continuous monitoring beats audits | Automated checks at short intervals catch regressions within minutes, not weeks. |
| Performance is a brand signal | Slow sites reduce trust and mid-funnel engagement, not just search rankings. |
Performance measurement is a commercial decision, not a technical one
Here is what I have observed working with SMBs in Luxembourg over the past several years. Most business owners know their website is important. Very few know whether it is actually performing. They check their homepage on a desktop, it loads quickly, and they assume everything is fine. That assumption is almost always wrong.
The clients who come to us after a traffic drop or a conversion slump often discover the same pattern. Their mobile performance is significantly worse than desktop. Their checkout or contact page is slower than their homepage. They have been measuring the wrong thing, or not measuring at all.
What I find most telling is that performance issues rarely announce themselves. A 0.8-second LCP regression after a plugin update does not trigger an alert. It just quietly erodes your rankings over the following weeks. By the time you notice the traffic drop in Google Search Console, the damage is already done.
The other blind spot I see regularly is treating performance as a one-time fix. A site that passes Core Web Vitals today can fail them next month after a new marketing tag, a CMS update, or a third-party script change. Performance is not a project with a finish line. It is an ongoing standard that needs monitoring like any other business metric.
My honest recommendation: start with Google Search Console’s Core Web Vitals report. It is free, it uses real user data, and it will show you exactly which pages are failing and on which device types. That is your baseline. From there, you can prioritise fixes by commercial impact rather than technical complexity. Combine that data with your analytics and you will have a clearer picture of your website’s actual contribution to your business than most SMBs ever achieve.
— Thomas
How Done helps Luxembourg SMBs improve website performance

Done is a Luxembourg-based web development and digital agency with over 350 completed projects. We build and maintain websites that are designed to perform, not just look good. Our approach connects technical performance metrics directly to your business goals, whether that means faster load times on your conversion pages, better Core Web Vitals scores for SEO, or continuous monitoring that catches regressions before they cost you traffic.
If you want to understand what your website is actually doing for your business, we start with a performance and marketing audit. From there, we build a prioritised plan that ties technical improvements to measurable commercial outcomes. Explore our web development services or find out why web investment pays off for SMBs like yours.
FAQ
What is website performance measurement?
Website performance measurement is the practice of tracking metrics that quantify how fast, responsive, and stable your website is for real users. The primary framework is Google’s Core Web Vitals, which includes LCP, INP, and CLS.
Which tools measure website performance accurately?
Google PageSpeed Insights and Google Search Console provide free access to both lab and field data. DebugBear and WebPageTest offer more granular synthetic monitoring. For real user data, Google Analytics 4 combined with CrUX provides the most reliable picture of actual user experiences.
How often should I measure my site’s performance?
Continuous automated monitoring at short intervals is more effective than periodic manual checks. Quarterly audits miss regressions that occur between review cycles and can cause weeks of ranking damage before they are detected.
Does a good PageSpeed score guarantee better rankings?
No. Google uses field data from real users, not the composite PageSpeed score, for ranking decisions. A high aggregate score can mask a failing individual Core Web Vital. Focus on passing all three Core Web Vitals thresholds at the 75th percentile rather than chasing a single number.
Why does mobile performance matter more than desktop?
Google uses mobile-first indexing, meaning it evaluates your site’s mobile performance for ranking purposes. Mobile users also tend to be on slower networks and less powerful devices, making them the most likely to experience performance issues. Measuring and optimising for mobile is not optional for any SMB that relies on organic search traffic.


