

Acknowledge in under a second: GDPR-safe Zapier webhooks for SMB AI
September 4, 2026
Validate GA4 Purchase Events to Stop Wrong Revenue for Online Stores
September 6, 2026
E-commerce ROI is (net profit ÷ total investment) × 100. Net profit means revenue after VAT, minus every cost tied to the sale: COGS, shipping, payment fees, ad spend, software and returns. Total investment uses that same cost base. A positive result means the campaign or store made more than it spent; a negative one means it is quietly losing money, no matter how healthy the top-line revenue looks.
TL;DR:
- Many Lithuanian store owners underestimate their costs, leading to inflated ROI figures that do not reflect actual profitability.
- Accurate ROI calculation requires including all costs such as COGS, shipping, fees, software, team time, and marketing spend, not just ad expenditure.
- Using ROI for strategic decisions and ROAS for tactical bidding is essential, with a focus on proper VAT adjustments and full cost modeling.
- Mismatches between platform reports and actual accounting data can mislead ROI assessments unless reconciliation is performed regularly.
- The true measure of profitability depends on clean data feeds from store, ad, and accounting systems, not just the formula or dashboard display.
Table of Contents
- What costs actually belong in an e. prekybos ROI skaičiavimas?
- ROI vs ROAS: which one should guide your decision?
- How do you calculate ROI step by step with real numbers?
- Why does your ROI look better on paper than in the bank?
- Which tools keep ROI reporting accurate month after month?
- What we see when e-commerce owners get their numbers wrong
- The mistake most ROI guides never mention
- Want your ROI numbers to actually match your bank account?
- Sources
What costs actually belong in an e. prekybos ROI skaičiavimas?
Most Lithuanian store owners undercount their costs by a wide margin. They plug in ad spend and product cost, get a flattering ROI, then wonder why the bank balance doesn’t match. The e. prekybos ROI skaičiavimas only works when the denominator is complete.
Here is what belongs in the calculation, whether you run the numbers monthly or per campaign:
- COGS and per-unit variable costs. Allocate these per order, not per SKU catalogue price, since bundled discounts and multi-item baskets skew a simple per-product view.
- Shipping and fulfilment, including returns. A returned parcel usually costs you twice: once to send it out, once to bring it back. Round-trip shipping on refused or returned orders belongs in the cost line, not just outbound postage.
- Payment processing and platform fees. Card processors, marketplace commissions, and your e-commerce platform’s transaction cut all erode margin before you see the cash.
- Software and agency costs. Subscription tools, email platforms, and any external help you pay for campaign management count as investment, not overhead you can ignore.
- Team time, warehousing and packaging. Even a small warehouse team or a spare room full of boxes has a real hourly cost that should be spread across orders.
- Marketing and advertising spend. Every euro spent on Meta, Google Ads, or affiliate commissions goes into the investment side.
Pick your calculation period deliberately. A single campaign gives you a tactical read; a full month smooths out seasonal noise; a lifetime view tells you whether the business model works at all. Running all three in parallel, rather than picking one and hoping it’s representative, is what separates a useful ROI calculation from a vanity number.
ROI vs ROAS: which one should guide your decision?
ROAS and ROI answer different questions, and mixing them up is the single most common measurement mistake we see in online retail. ROAS (revenue ÷ ad spend) tells you how much revenue a euro of ad spend generated. ROI (net profit ÷ total investment × 100) tells you whether that revenue actually made you money once every cost is subtracted.
- ROAS includes only ad spend and the revenue it drove. It ignores product cost, fees, and returns entirely.
- ROI includes the full cost stack: COGS, shipping, fees, returns, software and team time.
Breakeven ROAS = Average Order Value ÷ Contribution Margin per order. If your AOV is €50 and your margin per order (after COGS, shipping and fees, VAT excluded) is €20, breakeven ROAS is 2.5. Anything below that, and every sale is losing money on ads alone.
The VAT trap catches almost everyone at some point: ad platforms report VAT-inclusive conversion values, so if you calculate breakeven ROAS using gross revenue but a VAT-exclusive margin, the number comes out too optimistic. Strip VAT out on the margin side before you divide.
Use ROAS when you need a fast, daily signal for bid pacing. Use ROI when margins vary between products, when you’re pricing B2B deals individually, or when you need a monthly view for budget decisions. Growthegy’s analysis of ecommerce measurement backs this dual role: ROAS for tactical speed, ROI for strategic allocation.
How do you calculate ROI step by step with real numbers?
Pull your figures from four places: your store export for revenue and order counts, your ad account for spend, your shipping provider for fulfilment and return costs, and your accounting software for fees and overhead. Mixing these up, or trusting a single dashboard’s summary number, is where most manual ROI calculations go wrong.
Follow this sequence for any period, whether it’s one campaign or a full month:
- Compute net revenue. Take gross sales and remove VAT where it applies to your jurisdiction and product category.
- Subtract COGS and variable costs per order. Include product cost, packaging, and outbound shipping.
- Model returns. Multiply your expected return rate by the round-trip shipping cost and lost margin per returned unit, then subtract that from net revenue.
- Allocate fixed costs and ad spend attributable to the period, including software subscriptions and any agency fees.
- Calculate ROI and breakeven ROAS, then interpret the result against your monthly profit target.
Here’s a worked example for a single order, scaled to 500 monthly orders:
ROI here is (€7,535 ÷ €13,125) × 100, indicating a strong positive return. Breakeven ROAS, using an example AOV and contribution margin after removing VAT, can be calculated to determine the minimum ROAS needed to avoid losses. Any campaign running below that ROAS is quietly bleeding cash even if the ad account looks busy. TheMetricApp’s calculator methodology uses this same full-cost structure to benchmark category-level ROI, which is worth checking your own numbers against.
Why does your ROI look better on paper than in the bank?
Four mistakes inflate ROI on paper while the bank account tells a different story.
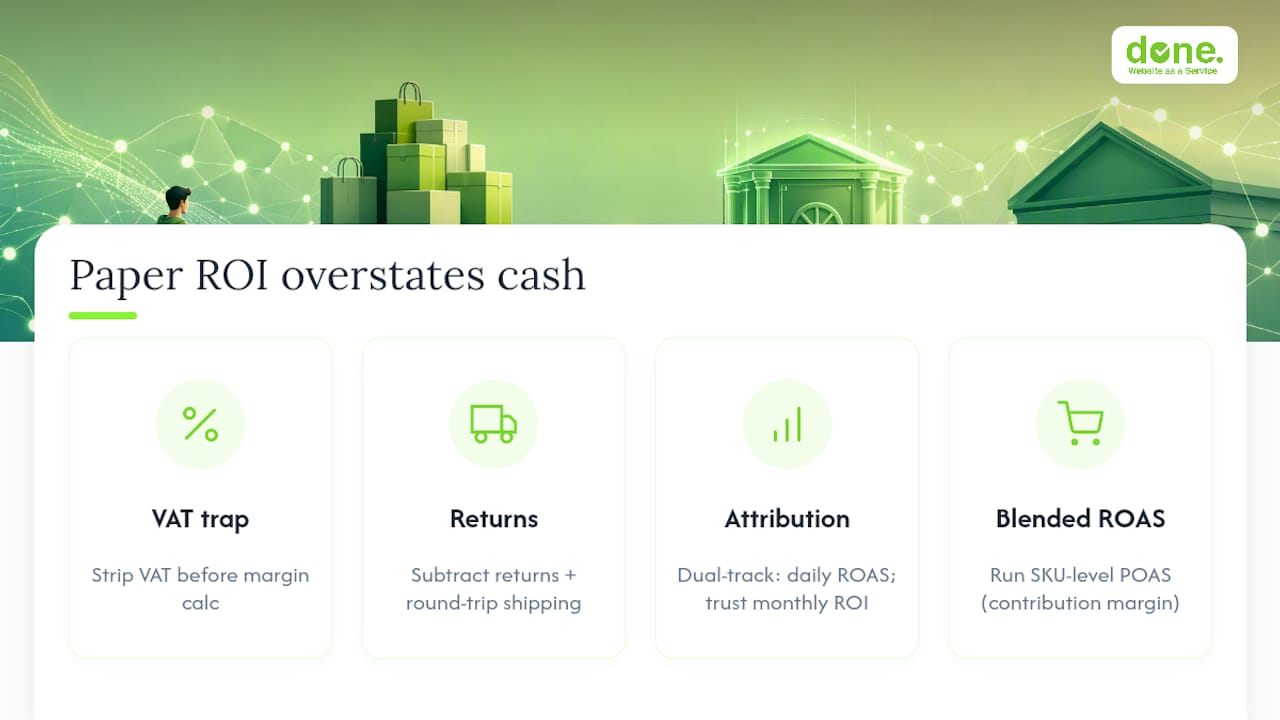
The VAT trap is the most common. Platform dashboards report VAT-inclusive revenue, so if you calculate margin without stripping VAT out first, breakeven ROAS comes out lower than it really is, making every campaign look more profitable than it actually is.
Returns and refused parcels are the second trap. Model them properly: take your expected return rate, multiply it by the round-trip shipping cost plus lost margin, and subtract that from net profit.
Attribution mismatches between ad platforms and your actual order data create a third gap. A safe fix is dual-track reporting: watch ROAS daily for pacing decisions, but only trust ROI figures once a month, when returns and refunds have settled and accounting has closed the books. Academic work on multi-touch attribution complexity shows why single-platform attribution is rarely the full picture.
Blended ROAS across your whole catalogue hides underperforming products. A bestseller with thin margin can mask a niche SKU quietly losing money on every ad click. Running contribution-margin analysis (sometimes called POAS, profit on ad spend) at SKU level, rather than trusting one blended number, is how you catch this before it scales.
Pro Tip: *Set a recurring monthly reminder to reconcile your ad dashboard’s reported revenue against your accounting export.
Which tools keep ROI reporting accurate month after month?
Connect four data sources before you trust any dashboard: your e-commerce platform (orders, refunds), your ad platforms (spend, reported conversions), your accounting software (fees, VAT, overhead), and your fulfilment provider (shipping and return costs).
The practical pattern that works for most small teams:
- Daily view: ROAS by campaign, for pacing and bid decisions.
- Monthly view: full ROI, including returns and reconciled accounting figures, for budget and hiring decisions.
- Tool types worth exploring: profit calculators for quick per-order checks, unified marketing dashboards that pull ad and store data together, and accounting or ERP connectors that sync fee and VAT data automatically.
Once a month, run a validation checklist: does the dashboard’s net revenue match your accounting export? Do return figures match your fulfilment provider’s report? If either answer is no, fix the data feed before you trust the ROI number it produces. A tighter digital campaign setup upstream also reduces how often these mismatches happen in the first place.
What we see when e-commerce owners get their numbers wrong
In our experience with e-commerce clients, the ROI number itself is rarely the problem. The data feeding it is.
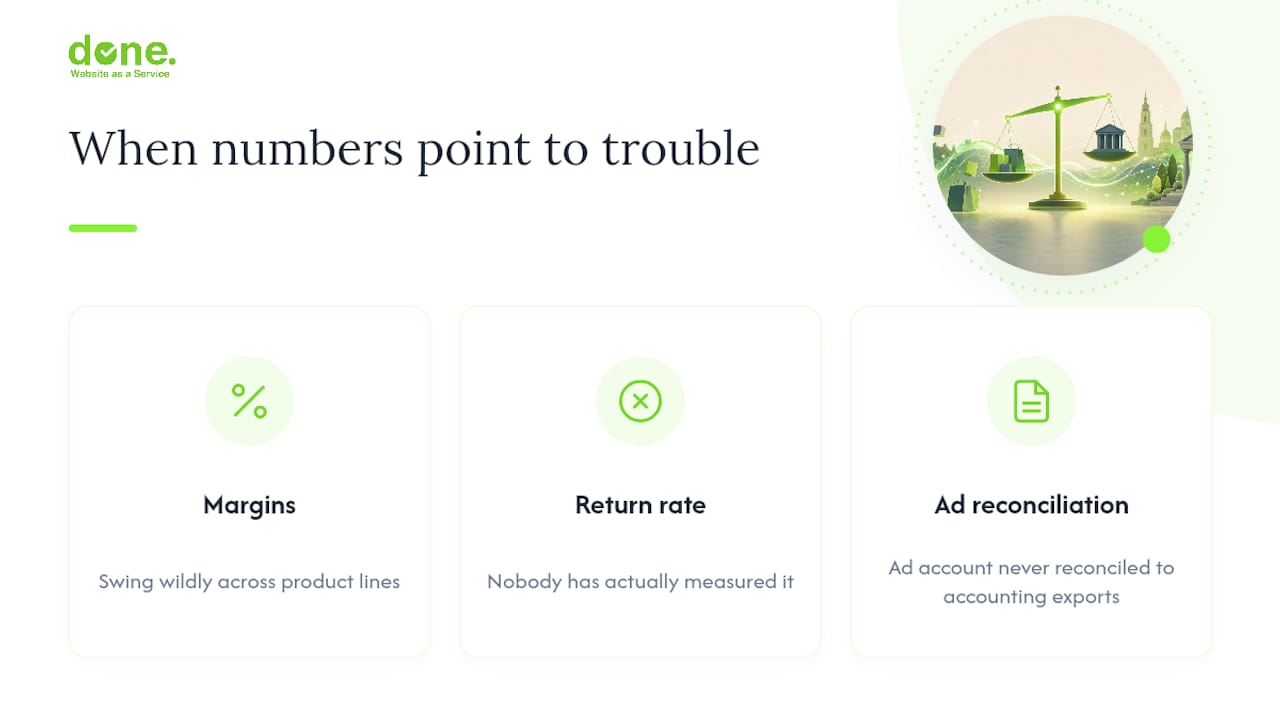
Three signals tell us a business needs outside help rather than a spreadsheet fix: margins that swing wildly between product lines with no clear cause, a return rate nobody has actually measured, and an ad account that has never been reconciled against accounting exports. Any one of those on its own is fixable in an afternoon. All three together usually mean the reporting setup needs rebuilding, not patching.
The mistake most ROI guides never mention
Most advice on this topic treats ROI as a calculation problem. It isn’t. It’s a data hygiene problem wearing a maths disguise.
The formula itself is straightforward enough that a school pupil could apply it correctly. What separates an accurate ROI from a misleading one is whether returns were modelled honestly, whether VAT was stripped from the right side of the equation, and whether the ad platform’s version of reality matches what accounting actually banked. Get those three things right and the percentage looks after itself.
Where conventional advice falls short is in treating ROAS and ROI as interchangeable, or worse, treating ROAS as good enough on its own. It isn’t. A campaign can hit a 4x ROAS and still lose money once returns and fees are counted, particularly in categories with high refund rates. If there’s one thing to prioritise first, it’s building the habit of checking ROI monthly against actual bank and accounting figures, not just trusting whatever number the ad platform surfaces on a Tuesday morning.
— Thomas
Want your ROI numbers to actually match your bank account?
We build the connection between your ad accounts, your store, and your accounting data, so the ROI figure on your dashboard is the same one your accountant sees at month close.

A typical engagement starts small: a data audit to find where your revenue, returns, and VAT figures currently disagree, a working dashboard showing daily ROAS and monthly ROI side by side, and a proper breakeven ROAS calculation for your actual margins, not a generic benchmark. If your current reporting has never been checked against your accounting export, that’s the first sign it’s worth a conversation. Take a look at how Done approaches marketing workflows built for lead generation and measurement and get in touch to see what a clean setup would look like for your store.
Sources
- Breakeven ROAS Explained: Formula, VAT Trap, and a Free Calculator | EcomLabs360
- ROAS vs ROI: What Ecommerce Brands Should Optimize | Growthegy
- E-Commerce Profit Margin Calculator 2026 | TheMetricApp