

Unbounce vs Instapage: best pick for paid campaigns 2026
August 8, 2026
Facebook ad automation for SMEs: a practical 2026 guide
August 10, 2026
Core Web Vitals are three field-measured metrics that Google uses to assess real user experience: Largest Contentful Paint (LCP) for loading, Interaction to Next Paint (INP) for responsiveness, and Cumulative Layout Shift (CLS) for visual stability.
Your immediate next step: open Google Search Console, pull the Core Web Vitals report, and check your 75th-percentile field scores for both mobile and desktop. If you have no Search Console access yet, run your primary URL through PageSpeed Insights. That single check tells you whether you have a problem worth fixing now.
- LCP: Good, Needs improvement, and Poor categories specified by Google’s thresholds.
- INP: Corresponding qualitative categories are defined similarly.
- CLS: Thresholds separate good and poor experiences, as per Google’s guidance.
Key takeaways
Passing Core Web Vitals requires all three metrics to reach “Good” at the 75th percentile in field data: LCP ≤ 2.5s, INP ≤ 200ms, and CLS ≤ 0.1, measured from real Chrome users via CrUX.
| Point | Details |
|---|---|
| Check field scores first | Open Search Console’s Core Web Vitals report before running any lab test; it shows which URL groups are failing in production. |
| LCP fixes deliver fastest ROI | Serve the hero image in WebP via a CDN with fetchpriority="high" to cut LCP without redesigning the page. |
| INP needs a tag audit | Remove or defer redundant third-party scripts; each one adds main-thread latency that pushes INP into the “Needs improvement” range. |
| Monitor at the 75th percentile | Use the web-vitals library or a GDPR-compliant RUM provider to alert on regressions, not just one-off lab scores. |
| Done handles complex cases | For multilingual, multi-domain, or custom-template sites in Central Europe, a structured agency audit pays for itself in recovered rankings and conversion rate. |
Table of Contents
- What do Core Web Vitals actually measure?
- How are Core Web Vitals measured: field data vs lab data?
- Which tools should you use to measure Core Web Vitals?
- How do you diagnose and fix each metric?
- How do Core Web Vitals affect Google Search rankings?
- How do you set up long-term monitoring for Central Europe?
- A practical Core Web Vitals audit checklist for SMBs
- What we’ve seen work for Central European SMBs
- How Done helps you fix and monitor Core Web Vitals
- Sources
What do Core Web Vitals actually measure?
Web Vitals is Google’s initiative to unify user experience quality signals into a single, measurable framework. The three Core Web Vitals each capture a distinct dimension of how a page feels to a real visitor.
Largest Contentful Paint (LCP)
LCP measures how long it takes for the largest visible content element to render in the viewport. That element is almost always a hero image, a large heading, or a background photograph. A slow LCP typically means the server is slow to respond, the image is unoptimised, or the browser is waiting on render-blocking resources before it can paint anything meaningful.
Interaction to Next Paint (INP)
INP replaced First Input Delay (FID) as the interactivity metric in March 2024. It measures the latency of every interaction a user makes during a page visit, from click to the next visual update. Heavy JavaScript, large event handlers, and third-party tag managers are the most common culprits. Marketing sites with multiple analytics scripts, chat widgets, and A/B testing tools tend to struggle here.
Cumulative Layout Shift (CLS)
CLS quantifies unexpected visual movement. When an image loads without reserved dimensions, or a late-loading ad pushes content down, the layout shifts. Google scores each shift by how much of the viewport moved and how far it moved. A CLS above 0.25 is genuinely disruptive: buttons shift under a user’s finger just as they tap.
| Metric | What it measures | Good | Needs improvement | Poor | Common root causes |
|---|---|---|---|---|---|
| LCP | Time to render largest visible element | ≤ 2.5s | 2.5s–3.2s | > 3.2s | Slow server, unoptimised images, render-blocking CSS/JS |
| INP | Latency of all page interactions | ≤ 200ms | 200ms–500ms | > 500ms | Heavy JS, third-party scripts, long tasks on main thread |
| CLS | Cumulative unexpected layout movement | ≤ 0.1 | 0.1–0.25 | > 0.25 | Missing image dimensions, late-injected ads, web fonts |
Metrics follow a lifecycle: experimental, pending, then stable. Once stable, Google commits to changing them no more than once per year, with any change documented in the metric changelog. That stability matters for planning: you can invest in fixes without worrying the goalposts will shift next quarter.
How are Core Web Vitals measured: field data vs lab data?
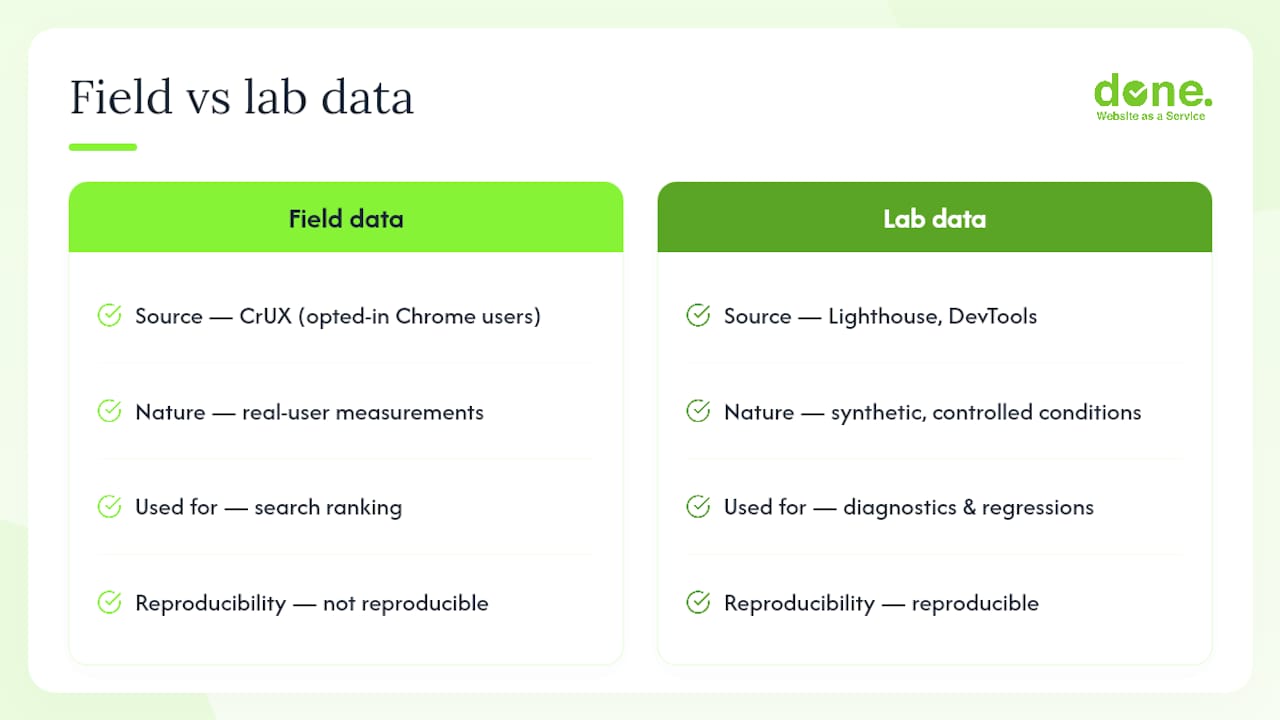
The distinction between field and lab data is where most teams go wrong. Field data reflects what real Chrome users experience on your live site. Lab data is a synthetic test run under controlled conditions.
Field data comes from the Chrome User Experience Report (CrUX), which aggregates anonymised performance measurements from opted-in Chrome users. Google uses CrUX field data to assess your site for search ranking purposes. A fast median with a slow tail still fails.
Lab data comes from tools like Lighthouse, which simulate a page load under fixed network and CPU conditions. Lab tests are reproducible and excellent for catching regressions during development, but they cannot capture post-load interactions, real network variability, or the cumulative layout shifts that only appear when a user scrolls or clicks.
Lab tools like Lighthouse are valuable for diagnostics but cannot fully replace field data. Use DevTools live metrics and manual interaction testing to catch post-load CLS and INP issues that a synthetic run will miss entirely.
A few practical boundaries for CrUX: it requires sufficient traffic to generate a score. Low-traffic pages, staging environments, and newly launched sites often have no CrUX data at all. In those cases, lab tools and third-party RUM providers fill the gap.
Pro Tip: When CrUX shows no data for a URL, check the origin-level report in PageSpeed Insights. Origin data aggregates all pages on your domain and is available at lower traffic volumes than individual URL data.
Which tools should you use to measure Core Web Vitals?
Each tool serves a different moment in the workflow. Using the wrong one for the wrong task produces misleading results.
- Google Search Console (Core Web Vitals report): Your first stop for production triage. Shows URL groups labelled Good, Needs improvement, or Poor based on CrUX field data. Identifies which page templates are failing at scale.
- PageSpeed Insights (PSI): Combines CrUX field data with a Lighthouse lab run in a single URL-level report. Best for quick checks on individual pages and for sharing results with clients or stakeholders.
- Chrome User Experience Report (CrUX): The raw dataset behind PSI and Search Console. Queryable via BigQuery or the CrUX API for custom analysis, historical trends, and competitor benchmarking.
- Lighthouse: Built into Chrome DevTools and available as a CLI tool. Runs synthetic audits with actionable diagnostics. Use it during development and in CI/CD pipelines to catch regressions before they reach production.
- Chrome DevTools: The Performance panel records a detailed trace of page load and interactions. The “Live metrics” sidebar shows LCP, INP, and CLS updating in real time as you interact with the page.
- web-vitals JavaScript library: A lightweight library from Google that measures all Core Web Vitals in real browsers. Drop it into your site to collect field data from your own users and send it to your analytics platform.
- RUM providers: Commercial real user monitoring tools aggregate web-vitals data at scale, provide dashboards, and alert on regressions. Collecting field Web Vitals reliably means reporting 75th-percentile values segmented by device and origin, which most RUM platforms handle automatically.
For low-traffic sites where CrUX lacks coverage, third-party measurement vendors can provide synthetic monitoring at higher frequency than Lighthouse alone, giving you a usable proxy until real-user data accumulates.
GDPR note for Central Europe: When you collect field data via the web-vitals library or a RUM provider, you are processing performance telemetry from real users. Under GDPR, this typically qualifies as legitimate interest when no personally identifiable data is attached, but you should confirm with your data protection officer that your RUM provider’s data processing agreement covers EU data residency. Prefer providers with EU-hosted infrastructure or on-premise options.
How do you diagnose and fix each metric?
Fixing LCP
The most common LCP element is a hero image. CDN and edge strategies, TTFB optimisation, and prioritising critical resources are the most effective levers for LCP improvement.
- Identify your LCP element using the Performance panel in Chrome DevTools or the PSI report.
- Check your server’s Time to First Byte (TTFB). If it exceeds 600ms, address hosting or caching before touching the image itself.
- Serve the LCP image in a modern format (WebP or AVIF), sized correctly for the viewport, and with
fetchpriority="high"on the<img>tag. - Add a CDN with edge caching. For Central European sites, choose a CDN with points of presence in Frankfurt, Amsterdam, or Warsaw to minimise latency for regional visitors.
- Remove render-blocking CSS and JavaScript that delay the browser from painting the LCP element.
Non-developer action: ask your hosting provider whether your plan includes a CDN. Many managed WordPress hosts include one by default. Switching it on can cut LCP by a second or more without a single code change.
Pro Tip: Add <link rel="preload" as="image" href="hero.webp"> in your <head> for the LCP image. This tells the browser to fetch it immediately, before the CSS parser discovers it. We’ve seen this single change move LCP from 3.2s to 2.1s on e-commerce category pages.
Fixing INP
INP is often the hardest metric for marketing sites with heavy client-side code. Reducing main-thread work and deferring non-critical JavaScript is usually the necessary fix.
- Audit your third-party tags in Chrome DevTools. Tag managers, chat widgets, and consent platforms each add main-thread tasks. Remove or defer anything not critical to the first interaction.
- Break up long tasks (those exceeding 50ms) using
scheduler.yield()orsetTimeoutto give the browser time to respond to user input between chunks. - For React or Vue applications, use the Interaction to Next Paint attribution data from the web-vitals library to identify which component is causing the delay.
Non-developer action: review your tag manager container. Every marketing tag you add increases INP risk. Audit quarterly and remove tags for campaigns that have ended.
Fixing CLS
Manual interaction testing is necessary to catch layout shifts that only occur during user interaction, such as expanding accordions or loading modal overlays.
- Set explicit
widthandheightattributes on every image and video element. This reserves space before the resource loads. - For web fonts, use
font-display: optionalor preload the font file to prevent the flash of unstyled text that shifts surrounding content. - If you inject ads or banners dynamically, reserve the space with a fixed-height container before the content loads.
For a concrete before/after: a Luxembourg e-commerce client had a CLS of 0.28 caused by a promotional banner injected by a marketing script 800ms after page load. Adding a reserved 90px container in the page template dropped CLS to 0.04 without touching the marketing script itself.
How do Core Web Vitals affect Google Search rankings?
Core Web Vitals are part of Google’s page experience signals, which also include HTTPS, mobile-friendliness, and the absence of intrusive interstitials. They contribute to ranking, but Google is explicit that great content can outrank a technically perfect page. The practical implication: fix your vitals to remove a ranking disadvantage, not to manufacture a ranking advantage.
The Search Console Core Web Vitals report is the clearest view of how Google sees your site’s performance. It groups URLs by template similarity, not one-by-one, so a failing product page template appears as one group representing thousands of URLs.
| Status | Meaning | Action required |
|---|---|---|
| Good | All metrics at 75th percentile meet “Good” thresholds | Monitor; no immediate fix needed |
| Needs improvement | At least one metric is in the “Needs improvement” range | Prioritise fixes; schedule within sprint |
| Poor | At least one metric is in the “Poor” range | Treat as urgent; fix before next release |
A group’s status reflects its worst-performing metric. A URL group with excellent LCP and CLS but a Poor INP is labelled Poor overall.
Suggested follow-up after identifying a failing URL group:
- Open a representative URL from the group in PageSpeed Insights to see which metric is failing and the lab diagnostics.
- Reproduce the issue in Chrome DevTools using the Performance panel.
- Deploy a fix and validate in the lab.
- Wait for the 28-day CrUX rolling window to update. Search Console reflects field data, so improvements take time to appear.
For broader SEO strategy, Core Web Vitals sit within a wider set of technical and content signals. Improving them reduces bounce rates and increases session depth, which feeds engagement metrics that correlate with rankings beyond the direct page experience signal.
How do you set up long-term monitoring for Central Europe?
A one-time audit is not enough. Field data changes as your codebase, third-party scripts, and traffic mix evolve. A monitoring workflow catches regressions before they affect rankings.
- Instrument your site with the web-vitals JavaScript library. Send measurements to your analytics platform or a dedicated RUM provider on the
visibilitychangeevent to avoid losing values when users navigate away. - Segment by device and region. Mobile and desktop scores diverge significantly. Central European visitors on 4G networks in Poland or the Czech Republic will show different LCP distributions than desktop users in Luxembourg city. Segment your dashboards accordingly.
- Set 75th-percentile alerts. Configure your RUM tool to alert when the 75th-percentile value for any metric crosses the “Needs improvement” threshold. Alert on trend, not just absolute value.
- Review on a fixed cadence. Monthly reviews work for stable sites; weekly for sites with active development. Assign a named owner, not a team, to sign off on the report.
- Integrate into your release pipeline. Run Lighthouse in CI/CD using Lighthouse CI or a similar tool. Block deploys that regress a metric by more than an agreed threshold (for example, LCP increasing by more than 500ms from the baseline).
GDPR checklist for Central European RUM:
- Confirm your RUM provider stores data in EU data centres.
- Ensure no session IDs or user identifiers are attached to performance payloads.
- Include RUM data collection in your privacy policy and, where required, your ROPA (Record of Processing Activities).
- Prefer providers with a signed Data Processing Agreement (DPA) under GDPR Article 28.
Pro Tip: For sites with low traffic where CrUX has no data, run synthetic Lighthouse tests on a 6-hour schedule using a monitoring service. This gives you a regression signal even before real-user data accumulates. Pair it with website performance metrics tracking to connect speed improvements to business outcomes.
A practical Core Web Vitals audit checklist for SMBs
Use this checklist to scope an internal audit or brief an agency. Time estimates assume a typical SME site of 20–200 pages.
- Pull Search Console report (30 minutes): identify failing URL groups and the metric causing each failure.
- Run PageSpeed Insights on 5 representative URLs (1 hour): one homepage, one product/service page, one blog post, one contact page, one high-traffic landing page.
- Record a DevTools Performance trace for each failing page (2–4 hours): identify LCP element, long tasks, and layout shift sources.
- Audit third-party tags in Tag Manager (1–2 hours): list every tag, its purpose, and its main-thread cost.
- Check image delivery (1–2 hours): confirm modern formats, correct sizing,
fetchpriorityon LCP images, and explicit dimensions on all media. - Test CLS manually (1 hour): click menus, expand accordions, scroll through pages with ads. Record any unexpected shifts.
- Document findings and prioritise (2 hours): rank issues by business impact and implementation effort.
Effort and cost bands:
- DIY (developer with 1–2 days): Image optimisation, dimension attributes, font-display fixes, and tag audit. Covers most CLS and some LCP issues.
- Small developer task (3–5 days): TTFB investigation, CDN configuration, JavaScript deferral, and preload hints. Covers most LCP and INP issues on standard CMS sites.
- Full agency engagement: Complex template restructuring, multilingual or multi-domain sites, custom JavaScript frameworks, and ongoing RUM monitoring setup. Necessary when the site has a bespoke build, a large page count, or GDPR-sensitive telemetry requirements.
When to bring in Done: if your site runs a custom template, spans multiple languages or domains, or if your team lacks the time to interpret CrUX data and translate it into a prioritised roadmap, an agency engagement pays for itself quickly. For mobile commerce performance, the stakes are particularly high: slow mobile scores directly reduce conversion rates, and the fix often requires both technical and content changes working together.
What we’ve seen work for Central European SMBs
The most common pattern we encounter is a site that scores well on desktop but fails on mobile, specifically on LCP and INP. The cause is almost always the same: a hero image served at desktop resolution to mobile users, combined with a tag manager container that has grown unchecked over two or three years of marketing campaigns.
In our experience, the fastest ROI comes from two changes applied together: serving correctly sized, WebP-format images via a CDN, and removing or deferring three to five redundant marketing tags. We’ve seen this combination move a site from a Poor mobile LCP of 4.8 seconds to a Good score of 2.3 seconds within a single two-week sprint, with no changes to the site’s design or content.
The second recurring issue is CLS on pages with dynamically injected content, particularly cookie consent banners and promotional ribbons. Reserving space in the layout before the script fires is a ten-minute code change that eliminates the shift entirely. The fix is trivial; the problem persists because no one has connected the CLS score in Search Console to the marketing banner added six months ago.
How Done helps you fix and monitor Core Web Vitals
Getting your scores into the “Good” range is one thing. Keeping them there as your site evolves is another. Done offers a structured Core Web Vitals engagement for SMBs in Central Europe that covers both.

A typical engagement starts with a full audit: Search Console triage, PageSpeed Insights analysis across your key page templates, DevTools traces, and a prioritised fix roadmap with effort estimates. Done then implements the highest-impact fixes, whether that means CDN configuration, image pipeline changes, JavaScript deferral, or template restructuring. The final phase sets up a RUM monitoring workflow with 75th-percentile alerts and a monthly review cadence, so regressions are caught before they affect rankings.
Engagements typically run four to six weeks for a standard SME site. To get started, share your Search Console access, a list of your five most important pages, and your current hosting setup. Done handles the rest. Find out more about Done’s web development services or contact the team directly to scope your audit.
Sources
- Understanding Core Web Vitals and Google search results | Google Search Central
- Web
- Core Web Vitals report – Search Console Help